


Articles
What is anomaly detection in manufacturing?
September 6, 2022
Introduction
Anomaly detection is rapidly becoming a powerful tool in manufacturing, helping identify rare events or patterns that deviate from expected behavior. Unlike traditional Statistical Process Control (SPC), anomaly detection provides a more flexible and adaptable approach to identifying quality issues in real time. In this post, we explore different anomaly detection models, how they can be applied in manufacturing, and how they complement SPC to enhance production quality and operational efficiency.

Anomaly detection is the process of applying advanced statistical methods data, with the goal of identifying rare events, patterns, and outliers that differ significantly from a dataset’s normal behavior.
Manufacturers are using this method to find problems in their data that could affect product quality and production operations. By gaining better visibility into variations into their processes, corrective action can be made sooner and more effectively. With increasing frequency, anomaly detection is being relied on as a more powerful complement to Statistical Process Control (SPC).

Why detect anomalies in manufacturing data?
In a manufacturing context, anomalies are simply signs that data has begun to act differently than it usually does. Anomalies can have both positive and negative implications. For example, anomalous data can reveal problems, like a malfunction on the production line. It can also represent an opportunity, by revealing a way to improve a manufacturing process.
A process variation that shows up as an anomaly in the data can be indicative that a defect has occurred, or is likely to occur. By monitoring these events in the data, manufacturers can learn important information that can help them control quality and prevent or investigate defects.
Anomaly detection models are also quite flexible and adaptable. They can pinpoint subtle or gradual changes in the data with more accuracy than traditional methods like SPC. Instead of relying on predetermined limits like SPC, anomaly detection models can uncover previously undefined errors. For these reasons, anomaly detection is being used when other methods have been unsuccessful to solve challenging manufacturing problems.
Types of anomaly detection models in manufacturing
There are three categories of anomaly detection models based on whether the data is structured or unstructured.
Supervised anomaly detection
Supervised anomaly detection involves training a model on a dataset where the instances are labeled as ‘normal’ or ‘anomalous’. The goal is for the model to learn the characteristics of normal and anomalous data points so that it can accurately classify unseen instances.
In a supervised setting, the manufacturing data used to train the model must contain examples of both normal and anomalous instances, and each example is labeled accordingly. The model learns to distinguish between the two classes based on the features present in the data. Once the model is trained, it can be used to predict whether new, unlabeled data points are normal or anomalies.
Sensor data from manufacturing machines can be collected and labeled as normal or anomalous (indicative of a defect or test failure). A supervised model can be trained on this data so that it learns the pattern of machine sensor readings that correspond to each label. When new sensor data is collected, the model can then determine in real time if the readings suggest a potential defect or need for intervention.

Unsupervised anomaly detection
Unsupervised anomaly detection is a type of machine learning that involves training a model on data without predefined labels or outcomes. Unsupervised learning algorithms must work to discover anomalies based on the inherent structure within the data.
Unsupervised anomaly detection is valuable for identifying patterns or anomalies in manufacturing data that might not be immediately apparent. For instance, in a manufacturing context, unsupervised models might be used to monitor production quality, where the algorithm flags products or processes that deviate from the established norm, potentially identifying new or unforeseen types of defects.

Semi-supervised anomaly detection
Semi-supervised anomaly detection is a hybrid approach that combines elements of both supervised and unsupervised learning. A semi-supervised approach is applicable when you have a small amount of labeled data (often only for the normal class) and a large amount of unlabeled data. The algorithm initially learns the structure of the data from the unlabeled set, trying to understand what typical data points look like. Then, it refines this understanding based on the labeled examples of normal instances, improving its ability to detect anomalies.
In a manufacturing scenario, a semi-supervised model might be employed where only normal operational data is labeled, and the algorithm needs to identify any operation that doesn’t fit this learned pattern as anomalous, aiding in the early detection of issues without extensive labeled anomaly data.
Anomalies in time-series data
Time-series data are observations that are recorded in a sequence of values over time. Each data point is timestamped when it was measured, and a value is allocated to it at the time it was recorded. This data is used to forecast expected anomalies within the data collected, and uncover outliers in the extreme data points within the dataset. Manufacturing process data falls into this category.
Anomalies within a time-series dataset are divided into three main categories:
Global anomalies
Also known as point anomalies, global anomalies exist outside the entirety of a dataset. They are the data points that deviate the most from other data within a given dataset.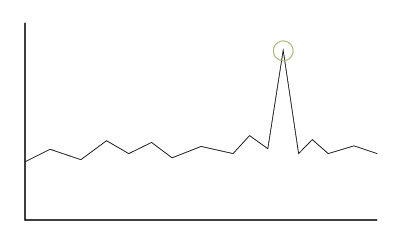
For example, if a control chart displays a data point outside the specified range, this can be considered a global anomaly.
Contextual anomalies
Also known as conditional anomalies, these anomalies differ greatly from other data within the same dataset, based on a specific context or unique condition.
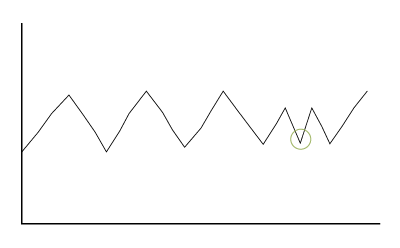
An example of a contextual anomaly can be illustrated on a series of temperature readings collected over time that follow a predictable pattern. A machine alternately heats up and cools in a cyclical manner as it operates. If the machine cools when it is expected to heat, this represents an anomaly, even though the unexpected cooling falls within the expected range of overall temperature.
Collective anomalies
Data points that deviate significantly from the rest of the dataset. On their own they are not necessarily outliers but combined with another time series dataset they collectively act like anomalies.
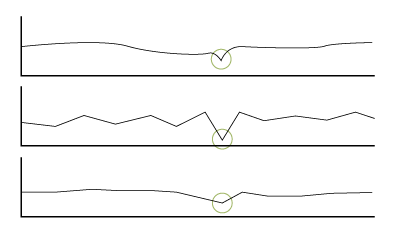
Collective anomalies can be more challenging to spot, since they require comparing similar points across different datasets. An example of when a collective anomaly could be found it the comparison of power supply data for different machines. If the power for the whole plant were to falter, a dip would be seen across all machine data at the same time. This finding would clearly indicate an issue with the central power supply, as opposed to a specific machine.
How does anomaly detection differ from SPC?
To put it simply, anomaly detection is a more advanced method of detecting potential issues in production data than SPC. But that doesn’t mean that it renders SPC obsolete. Both methods can be applied to manufacturing data either together or separately to help control quality.
The main differences are in the limitations in which each method can be applied. SPC is based on pre-determined, fixed control limits. Anomaly detection is a more fluid and flexible method of discovering inconsistencies on manufacturing data.
We’ve written another post that gets into much more detail about the difference between anomaly detection and SPC.
Do you need more than SPC?
By leveraging the anomaly detection, SPC, and machine learning capabilities of LinePulse, we can help you monitor and analyze your production data in real time to detect anomalies in your manufacturing data and uncover opportunities to improve your part quality.