


Articles
Anomaly detection beats SPC to manage quality
October 3, 2023
Introduction
Many manufacturers ask how LinePulse differs from SPC and how it can help reduce scrap and rework when SPC is already in use. While SPC is a valuable tool for detecting deviations once control limits are breached, anomaly detection can spot subtle issues earlier, even when signals remain within control limits. This article explores how combining both approaches can lead to more proactive quality management and improved production outcomes.

When introducing manufacturers to LinePulse, we are often asked, “What makes it different from SPC?” How can it help improve scrap and rework if SPC is already being used to control quality?
Every manufacturer has experienced a situation where defective parts are being created, even when all measured signals are within control limits. And by the time control limits are exceeded, a serious problem has sometimes already occurred. Due to the development of advanced statistics, there are now more accurate ways to determine how defects occur, find their root causes, and even see them coming so that they can be prevented.
We refer to the method of finding issues (or anomalies) in manufacturing data as “anomaly detection”. To make the distinction between SPC and anomaly detection, let’s start by exploring how each method was developed.
The history of Statistical Process Control
Statistical Process Control (SPC) traces its origins back to the early 20th century. It was developed by Walter A. Shewhart, a physicist and statistician at Bell Telephone Laboratories, in the 1920s. Shewhart’s pioneering work focused on applying statistical methods to control and improve manufacturing processes. He introduced the concept of control charts, which graphically displayed process data over time, enabling manufacturers to differentiate between common cause and special cause variation.
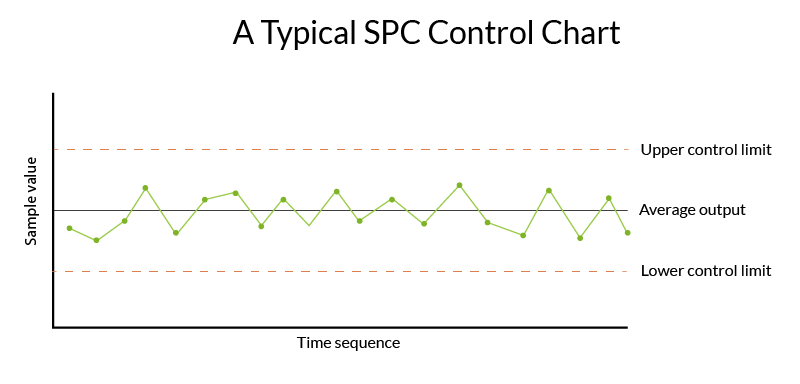
Today, SPC is used extensively in manufacturing to control quality by systematically monitoring and managing production processes. Control charts provide a visual representation of process behavior, and help manufacturers detect deviations from desired quality standards by ensuring that the process functions within pre-defined upper and lower specification limits.
Statistical Process Control (SPC) has earned its reputation as a foundational technique for understanding and controlling quality. It has been an indispensable tool for quality and engineering teams across various industries and has played a major role in the manufacturing industry’s progress throughout the 20th century. SPC shines brightest when applied to tightly controlled, well-known processes, offering valuable insights into process stability and variation.
A need for new methods to control quality
SPC is a very powerful and effective tool; however, SPC cannot eliminate every potential defect or deviation from quality standards. As manufacturers face increased competition, sustainability concerns, and thinner margins, producing products right the first time has never been more important.
In the dynamic landscape of manufacturing, proactive quality management is not just a preference but a necessity. Manufacturers are constantly seeking more powerful methods to preempt quality problems, reduce scrap, and minimize rework. This is where anomaly detection comes in.
Understanding anomaly detection
Anomaly detection is a method that leverages statistical techniques to identify deviations or anomalies in data. The work of Walter A. Shewhart laid part of the foundation for its development. Throughout the 20th century, countless other statisticians and researchers expanded on techniques to detect anomalies.
Anomaly detection saw significant development with the rise of computer technology, as well as the advent of machine learning and data mining in the latter half of the 20th century. Researchers began exploring more sophisticated statistical techniques, such as clustering, density estimation, and distance-based methods, to identify anomalies in large and complex data sets. The application of anomaly detection expanded beyond traditional statistics and was used anywhere data could be found. The emergence of artificial neural networks and deep learning in recent years has advanced anomaly detection, allowing for the detection of complex, non-linear anomalies in even larger and more complex data sets.
Anomaly detection works by analyzing historical manufacturing data to establish a baseline or “normal” status for a process. Subsequently, it operates in real-time, alerting users when the data strays from this established “normal.” The real strength of anomaly detection lies in its ability to detect and help resolve production issues with greater speed and precision than SPC operating in isolation.
An example of anomaly detection
SPC is easily understood. Data is monitored, and when it exceeds the fixed control limits on either side, a problem is identified and action is taken.
Anomaly detection works by finding the “normal” patterns in the data, represented by the green part of the chart below. When the data begins to behave differently than its previous normal, a problem is identified. In this example, we can see that a problem is identified even though the data is technically within control limits. This is one way anomaly detection can determine more subtle problems in the process than SPC can find. The chart is a simplistic example, but anomaly detection is capable of uncovering complex patterns that aren’t so easily seen with the naked eye.
Anomaly detection doesn’t even need to have pre-defined control limits set up to find problems in the data. It uses historical data to benchmark what a signal’s data should continue to look like, and any trend or sudden change that doesn’t match will be identified.
Data from multiple signals and sources can also be analyzed together to find anomalies in the relationship between them, meaning that it is possible to detect anomalies that occur only when one or more signals are looked at together. Special algorithms are used to determine the amount with which signals are out of sync with each other, and alerts are issued when this begins to increase significantly. This often results in issues being detected earlier than they would otherwise be.
How do SPC and Anomaly detection work to control quality in manufacturing?
Here is a summary of the differences between SPC and anomaly detection for controlling quality in manufacturing:
SPC methods of quality control
- Control limits: SPC employs predetermined specifications or control limits to regulate the manufacturing process.
- Fixed rules: SPC detects issues when data points breach predefined control limits.
- Single variate: SPC primarily analyzes one variable at a time, making it less effective at capturing complex interrelationships between variables.
- Pre-defined: SPC can only detect problems or defects that have been previously identified and incorporated into the control limits.
Anomaly detection for quality control
- Adaptive learning: Anomaly detection learns from historical data to establish what constitutes “normal” for a given process. This adaptability enhances its ability to identify subtle changes and trends.
- Unsupervised: It operates in an unsupervised manner, detecting issues when the process deviates from normal functioning, regardless of whether specific defects have been predefined.
- Multi-variate: Anomaly detection can identify issues in individual signals or in combinations of multiple variables. This multi-variate approach enables a more holistic understanding of the process.
- Flexible: Anomaly detection can discover previously unknown problems or defects. Its adaptability allows it to adapt to evolving conditions.
Can Anomaly Detection Replace SPC?
Anomaly detection can uncover problems even when SPC controls have passed. When fully implemented in a manufacturing plant, it can provide important insights that help reduce scrap and rework far more than SPC alone. Manufacturers who are embracing Industry 4.0 tools and technologies are already realizing how it can reduce manual efforts to analyze data and prevent quality issues from impacting production.
Anomaly detection is a powerful, more advanced tool than SPC. However, it is essential to recognize that while anomaly detection is powerful, it does not render SPC obsolete.
SPC relies on fixed control limits. There will always be situations where fixed limits apply when regulatory and contractual requirements demand strict adherence to predefined standards. SPC continues to play a pivotal role in ensuring that these specifications are met and maintained.
Using SPC and Anomaly Detection together
So, how can manufacturers harness the best of both worlds—the fixed nature of SPC, and the adaptability of anomaly detection? This is where predictive quality solutions like LinePulse come into play.
LinePulse is a predictive quality tool that primarily utilizes anomaly detection to predict and notify users of potential quality problems during production. Users are provided with real-time insights into deviations from normal, enabling swift action to rectify issues before they escalate. This state-of-the-art platform also incorporates most basic SPC charts and functions, seamlessly integrating the strengths of both approaches.
As users become increasingly acquainted with the accuracy and effectiveness of anomaly detection, they may find themselves relying less on traditional SPC control charts. This shift in approach marks the future of quality control in manufacturing.
In conclusion
In the ongoing quest for quality, manufacturers have at their disposal a diverse toolbox of methodologies. Statistical Process Control (SPC) offers stability and control in well-established processes. However, as the industry evolves towards a more proactive and adaptive approach to quality management, the benefits of anomaly detection are becoming more and more apparent.
In the end, the choice between SPC and Anomaly Detection need not be an “either/or” decision. Manufacturers can embrace both methods, leveraging innovative solutions such as LinePulse to realize the benefits of both.