
Understanding machine learning with SHAP analysis
Last updated on August 26th, 2022
In conversations with customers, we’re often asked to explain how our machine learning models come up with their predictions. Engineers want to understand what they are implementing on a production line. The trouble is that machine learning models, by their very nature, are complex and hard to explain.
One useful tool in understanding machine learning models is SHAP analysis, which attempts to portray the relative impact of variables on the output of the model. It can still be complicated, since there may not be just one variable that you can point to as the reason the machine learning model gave the answer it did. However, a SHAP analysis can give insights as to the most significant factors and the influence of variables on the result.
What is SHAP Analysis?
If you Google ‘SHAP analysis’, you will find that the term comes from a 2017 paper by Lundberg and Lee, called “A Unified Approach to Interpreting Model Predictions”, which introduces the concept of SHapley Additive exPlanations (SHAP). The goal of SHAP is to explain a machine learning model’s prediction by calculating the contribution of each feature to the prediction.
The technical explanation is that it does this by computing Shapley values from coalitional game theory. Of course, if you’re unfamiliar with game theory and data science, that may not mean much to you. Simply put, Shapely values is a method for showing the relative impact of each feature (or variable) we are measuring on the eventual output of the machine learning model by comparing the relative effect of the inputs against the average.
SHAP Analysis Explained
Think of buying a second-hand car: You have a particular make and model in mind and a quick search online shows a variety of prices and conditions. In terms of coalitional game theory, the “game” is predicting the price of a specific car. The prediction will have a combination of features, called a “coalition”. The “gain” is the difference between the predicted price for a car against the average predicted price for all combinations of features. The “players” are the feature values that you input into the model which work together to create the gain (or difference from the average value).
Say the average price of your desired car is $20,000. Several factors will move that price up or down for a given vehicle. Age, trim level, condition, and mileage will all influence the price on the vehicle. That’s why it can be difficult to tell if a specific car is priced properly above or below market given all the variables.
Machine learning can solve this problem by building a model to predict what the price should be for a specific vehicle, taking all the variables into account. A SHAP analysis of that model will give you an indication of how significant each factor is in determining the final price prediction the model outputs. It does this by running a large number of predictions comparing the impact of a variable against the other features.
In our example, it’s easy to see that if I look the prices of cars with varying mileage but the same model year, condition and trim level, I can ascertain the impact of mileage on the overall price. SHAP is a bit more complicated since the analysis runs against the varying ‘coalitions’ or combinations of the other variables to get an average impact of the mileage of the car against all possible combinations of features.
In our example, we would end up running a machine learning model varying mileage against all the possible combinations of trim level, model year and condition. Obviously, this means running a lot of combinations through the machine learning model, as the number of combinations grows exponentially with the number of variables you are looking at.
In the used car case, we would have the following coalitions:
- Trim Level
- Mileage
- Model Year
- Condition
- Trim Level + Mileage
- Trim Level + Model Year
- Trim Level + Condition
- Mileage + Model Year
- Mileage + Condition
- Trim Level + Mileage + Model Year
- Trim Level + Model Year + Condition
- Mileage + Trim Level + Condition
- Mileage + Model Year + Condition
- Mileage + Trim Level + Model Year + Condition
Take the output of all these predicted prices and compare it to the average of all the predictions, and you can calculate the overall average impact (or Shapely value) of a feature against the average price predicted by the model. A SHAP analysis presents these visually with an indication of the influence on the outcome: within each line, higher values are represented in red and lower in blue.
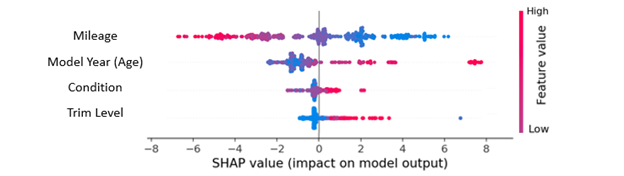
So, what does the SHAP analysis for our imaginary car pricing exercise tell us?
Unsurprisingly, higher mileage decreases the resale price of the car and lower mileage increases it. From the graph above, this effect is linear around the average miles, so we shouldn’t expect a disproportionate discount based off the mileage of the car.
Our other three variables tell a different story.
Model Year, Condition and Trim Level each skew the prices higher disproportionately with higher trim, better condition, and newer vehicles. From here, we can dive further into the analysis: Model Year shows a clustering of new vehicles on the right-hand end of the trace, with the gap representing the depreciation hit new vehicles take in the first year of ownership.
Explaining Machine Learning with SHAP Analysis
SHAP analysis can be applied to the data from any machine learning model. It gives an indication of the relationships that combine to create the model’s output and you can gain real insights into the relationships between operations on your production line or the behaviour of in-service vehicles.
As a solution to the difficulties of explaining machine learning, SHAP analysis can help engineers understand the effect of the inputs of the model and give further insights into the systems they are building, making it another valuable tool in the engineer’s toolbox.
Share on social: