
Last updated on December 11th, 2023
Case Study
Reducing warranty claims in faulty transmissions
Objectives
- Reduce warranty claims through enhanced end-of-line testing with machine learning
- Accelerate root cause analysis for faulty transmissions
Challenge
- Training data was drawn from only 100 units, none of which failed EOL tests
- Client required real-time results as part of a new end of line test
Key Results
Reduced number of signals requiring RCA by
99.8%
Costs from warranty claims reduced up to
30%
Background
A leading Tier-1 transmission supplier wanted to reduce warranty claims by identifying manufacturing defects using production and end-of-line test data. The EoL test involved more than 100 steps for a variety of performance-based quality assessments, which were ultimately analyzed by an SPC-based program. However, the program only analyzed 10% of the data collected from each unit, requiring an engineer to inspect all of the data manually in cases of potential failure.
Problem
The client provided Acerta with training data for LinePulse drawn from a dataset of 100 units, all of which had passed the original end-of-line test and none of which had returned a warranty claim. Their goal was to reduce the number of false negatives generated during end-of-line testing, and minimize the time engineers needed to spend evaluating datasets manually. This meant that LinePulse needed to deliver real-time results based on training data which contained only normal units.
Solution
Acerta’s team began by gathering information about the client’s manufacturing and data collection processes, which formed the basis for our intelligent feature engineering. Our resident industry experts identified non-polynomial features as potentially useful based on similarities between this application and past use cases. Acerta’s data scientists conducted a feature reduction, deploying LinePulse to prune out features that had little or no value to the final scoring algorithm.
Using unsupervised machine learning methods, LinePulse generated an abnormality score for each transmission at the end of the line. The score evaluated both single signal and multi-signal relationships, along with their expected behavior in each test step, and across several steps. It was calculated using the reconstruction error of different models in the ensemble.
Transmissions from the test dataset were sorted based on their abnormality scores, with LinePulse identifying the “least explainable” portions of the data.
Results
Despite working from a small, unlabelled dataset, LinePulse was able to generate a valid abnormality score for each transmission at the end of the line. The platform uses data from multiple tests simultaneously to identify the signals with the greatest impact on abnormality score.
In one instance, LinePulse identified a causal link between pressure delays and rotation delays. Detecting these specific signal relationships accelerated root cause analysis of transmission issues. It reduced the number of signals requiring manual investigation from approximately 4,000 per transmission to ten.
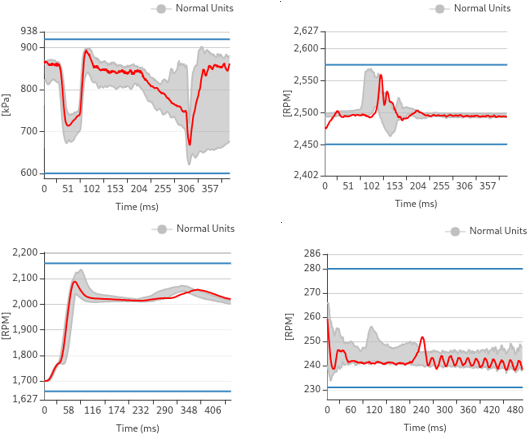
LinePulse was able to conduct multi-signal failure detection, something that was not possible with the client’s existing SPC program. As indicated in the accompanying charts, there was no clear threshold crossed (i.e., no extreme value) that would have triggered an alert from the existing SPC program. However, LinePulse identified these subtle deviations automatically and cross-correlated the abnormal region with other signals from the same transmission unit to ensure a high confidence score on its reporting.
According to the client, the new EOL test deployed via LinePulse would save the company up to 30% of the costs from warranty claims.