
The shift left in manufacturing quality
Last updated on March 18th, 2024
Quality management in manufacturing is changing. Maturity in data collection, artificial intelligence and cloud computing mean that it is now possible to analyze manufacturing data at scale and make business decisions on those insights. This trend is sometimes referred to as Quality 4.0, and more specifically, predictive quality. It represents a “shift left” in quality management.
“Shift left” is a concept borrowed from software development. It emphasizes moving quality testing and debugging to an earlier stage in the development process. Traditionally, these activities were performed in the later stages of development or even after the software was deployed. The shift left approach aims to bring these activities closer to the beginning of the development cycle.
Early testing and validation of code can catch defects, vulnerabilities, and bugs at an early stage, allowing developers to address them promptly. The earlier a bug can be detected, the more efficiently it can be fixed. To put it visually, here is what the shift left looks like when we track the attention paid to quality in software development.

How can the shift left model work for quality in manufacturing?
Software is a completely different process than manufacturing physical products. But the same shift left thinking can still be applied.
Traditionally, manufacturers rely on detecting defects to control quality in their facilities. They use end-of-line or in-process testing to weed out defective parts and ensure that they don’t get shipped.
Detecting defects can help manufacturers ship quality parts, but it does not address important metrics such as scrap and rework rates, OEE, and other costs associated with poor quality. To address this, the focus on quality must move from the end of the process towards the beginning. There needs to be a shift toward defect prediction and less focus on defect detection.
By shifting left, quality is addressed long before end-of-line tests. In-process verification is a step in the right direction. These tests catch problems before the end of a production cycle. Some would be inclined to simply add more tests earlier in the process to cause the shift left. This is not a perfect solution either.
Tests are expensive to implement as additional equipment investments are required, not to mention the engineering labor required to define, implement, and maintain the additional testing steps. Adding additional testing steps can also create bottlenecks in the process, which can interfere with cycle time and production targets.
The solution to shift left in manufacturing is predictive quality—that is, predictive analytics that are applied to manufacturing data and curated to be operationalized on the shop floor.
Adopting predictive quality in manufacturing
The success of this shift left with predictive quality hinges on high quality data. Luckily, the manufacturing environment is rich in information spanning multiple data sources:
- Process parameters and measurements (including direct machine readings)
- Product dimensions and attributes (serial numbers, part number, BOM, material, etc.)
- Test data (quantitative measure or indication of quality, including failure modes) as well as high fidelity test performance data
- Audit inspection and warranty information
Any data associated with the part or product produced can be aggregated in a part-centric way—creating a digital thread of data for every part produced.
By monitoring process and product parameters together with test data, relationships between process (or even material) variation and part quality can be determined. Throughout production, detailed manufacturing and test data can be scored against AI models that have been trained for the specific purpose of predicting quality issues.
The more process variation can be used to anticipate end-of-line and in-process issues, the more it is possible to shift investment away from testing at the end of the process. When the process is more volatile or less trusted, more testing is necessary. When there is more insight into the relationships between variables in the process, less reliance is needed on inspection and testing.
Applying this approach to a machine or a production line can result in major improvements. But we can even take it one step further. Data can be traced not just within a single facility, but through the supply chain, with visibility upstream before value-add processes lead to higher costs. Identifying an issue in the $3 component at a Tier-2 supplier, rather than the $200 sub-assembly at Tier-1, or $1000 repair/rework at OEM final assembly—this is where the data, and predictive quality, become not just cost effective, but invaluable.
How does predictive quality work?
Anomaly monitoring
As the production process runs, process and product data are collected and ingested in real-time. A combination of machine learning models are trained on the data to learn the “normal” or expected conditions. The predictive quality tool leverages these models to monitor significant and critical signals in production in real-time, and alerts engineers when there is an anomaly that can lead to defects. This way—whether the process is becoming less controlled, tolerances are stacking, or measurements are starting to trend or spike—anomaly detection can call attention to suspicious patterns automatically and early.
Suspect signals can be monitored in isolation, or a group of signals can be isolated together to better keep a close eye on them, all accessible within the same platform. Traditional SPC charts can be viewed and capability reports generated with a few clicks, since all relevant data is always available.
Anomaly detection can work in tandem with SPC. SPC relies on fixed, pre-determined control limits. Anomaly detection is adaptable, even if the process center changes. It can be used to monitor multi-variate relationships, which greatly expands its scope across multiple production stages. Both SPC and anomaly detection have their place in the new quality paradigm. Anomaly detection can be used to inform new fixed control limits. It can also detect issues that SPC overlooks. As anomaly detection learns over time, engineers may find they rely on SPC less and less.
Automating Root Cause Analysis
Whenever defects slip through and are discovered during testing or audits, automated root cause analysis accelerates the troubleshooting process. The underlying ML and AI models link the defect with any anomalies in the upstream data from the affected part’s production cycle. It generates a list of possible contributors to the defect, arranged by the likelihood of their contribution. This enables an automated and data driven investigation, where the root cause can be identified in a fraction of the time it would take to conduct a traditional manual analysis.
Next, the causal variables found can be isolated and monitored through the anomaly detection process described above. Engineers are alerted when the conditions that caused the previous defect occur again, so they can intervene immediately to prevent another quality gate failure.
Automating root cause analysis is in itself revolutionary for manufacturers. No longer do quality teams need to struggle with the decision to “sign off” on out-of-control processes, since performing the investigations and solving the problems poses less risk to production.
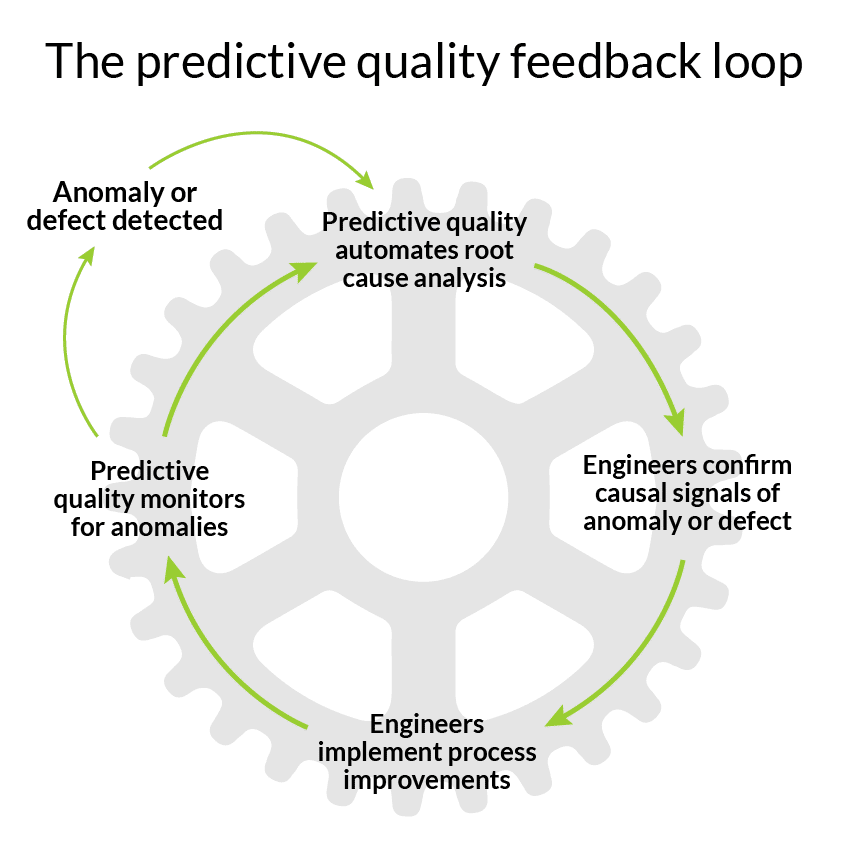
Operationalizing the predictive quality feedback loop
The predictive quality feedback loop enables manufacturers to continuously improve quality outcomes. Any predicted or detected defect can be verified in a timely manner through the root cause analysis process. Continuous confirmation of a defect and its cause fuel the learning process of anomaly monitoring, improving the impact of predictions and identified insights. Data from products produced globally is aggregated in a single cloud-based platform, which scales this learning across the entire organization, and not just in the isolated silos of a production line or facility.
The predictive quality feedback loop presents an Industry 4.0 version of continuous improvement. It empowers engineers with data and AI to support their domain knowledge, and offloads laborious number-crunching. Quality and engineering teams can focus on what they do best, with unparalleled speed and accuracy.
Shifting left in two stages
Predictive quality technology is now ready for commercial use. Early adopters have already begun to take advantage of it in their facilities.
Every manufacturer has a diversity of facilities, where some have been around for decades, while others are green field sites or lines with the latest equipment, ramping production of new products. This creates an opportunity to implement it in two phases:
- Shift left in stable production
- Shift left to New Product Introduction phase (NPI)

Phase 1: Shift left in stable production
The goal of this stage is to optimize production. It is characterized by lines or processes that have been in operation for at least one year. Scrap is at most 10% on the worst days, but <5% on average. Rework is 20% on the worst days, but less than 10% on average. FTT (first time through) may also fluctuate at 80% or above. Predictive quality can improve these KPIs and increase profit margin. Production processes that have reached stability and have history are also a great place to start evaluating solutions—and a great place to prove out and build trust in AI capabilities within the organization.
A manufacturing process that has already obtained stable production has a wealth of historical data, which can be used to train predictive quality models to create insights. It has an abundance of failures that have already been recorded. From these, the relationships between process and outcome data can be learned and used to identify which specific process parameters or measurements should be closely monitored.
For example, in welding processes, destructive tests must be performed to ensure quality. Of course, only a small number of units can be tested this way. By connecting data from these tests with data from the welding process, predictive quality tools can predict which units will have defects by detecting anomalies in the process data that match the conditions that led to failed tests in the past. This can ultimately inform destructive test sampling, focusing the attention on high-suspect parts.
In processes with 100% sampling, the learning and understanding of relationships between in-process data and outcomes is even more reliable. Predictions can continuously be validated and improved, and a feedback loop can be established between process variation and trends, and final part quality.
Phase 2: Shift left to New Product Introduction phase
The first phase of our shift left is still new to many manufacturers, and will take time to adopt. Once predictive quality is implemented in stable production, trust in the technology and improved capabilities of the platform can offer improvements even farther “left” in the process.
Line construction
When a system integrator initially builds a production line, acceptance tests ensure its capability to produce high-quality parts and meet specified requirements. However, the process of dismantling, shipping, and setting up the system at its final location can introduce variations that challenge the replication of the initial production conditions. This can lead to the risk of unexpected operational issues and the production of defective parts.
To mitigate these challenges, a predictive quality tool can monitor manufacturing data from both the initial setup and the onsite operation. Feeding data from these two locations is made simple through the cloud. The tool efficiently identifies any process variations or inconsistencies between the two setups. This approach facilitates a smoother transition from design to onsite setup, overcoming the limits of traditional on-premises systems and aiding both integrators and manufacturers in resolving any discrepancies more collaboratively.
Process control
Compared to stable production, line ramp-up is plagued with inefficiencies. Typical ramp-up times can last up to a year. In the first three to six months, a manufacturer is very likely to see high rework rates of 40-60%, and >10% scrap rates. For lines where the manufacturer is introducing a product they don’t have experience producing, figuring out how to control the process is especially difficult, as there are no existing control plans they can fall back on.
By leveraging manufacturing data, a predictive quality solution can allow manufacturers to experiment with potential controls and predict their impact on quality KPIs. It could also similarly recommend changes to the fixed control plans by learning from the process data for good parts.
Over time, it only becomes more accurate. These early insights are invaluable for manufacturers. Engineers and algorithms learn together what makes their new process work. Testing time can be kept as short as possible, and the impact of process improvements is transparent.
Design for manufacturability
Ramping up the process to stable production typically involves iterations in the original design and specs to account for unexpected oversights in design for manufacturing. New part numbers are introduced at the design stage. With the ease of isolating these part numbers through the predictive quality tool and tracking where exactly in the process they may be causing defects, feedback can be quickly relayed to design teams.
An automotive seat manufacturer reveals an example of this use case. To move to a just-in-time (JIT) approach, the manufacturer recently invested in an advanced flex line that changes between seat frame models automatically. The manufacturer starts to notice sporadic defects in the end stops of the seat adjustment motor, causing the seat to stall at end range during a functional test. The process data showed that the installation location of the motor varied with each model change, causing some motors to be misaligned. Before the new flex line was installed, the line operator would make this adjustment during model changeover. This detail was unknown to the product and line designers.
By applying predictive analysis, the data showed that the pickup points for the frame allowed more variation than required. They also varied from batch to batch. With this information, the design team was then able to adapt by adding a reference point to the seat frame design so that the motor mounting station no longer needed calibration with each changeover as the reference came from the part itself.
Share on social: