
How to automate root cause analysis
Last updated on May 18th, 2024
LinePulse has removed the manual efforts required by data scientists to train and deploy machine learning models used for root cause investigation. This means that all of the manual effort required in the past; collecting, filtering, manipulating and processing the raw data to feed into a model architecture that is developed specifically for the task of identifying root causes of discrete manufacturing issues, has been replaced with a few button clicks that any quality or manufacturing engineer can conduct.
Here’s a brief overview of how it works:

LinePulse is the key to automating root cause analysis
LinePulse is a predictive quality platform for discrete manufacturing.
Once LinePulse is up and running in your plant, the platform ingests data continuously, in real time. Getting data into LinePulse is a one-time step. There is no need to run around the shop floor, gathering data from various machines on a USB stick each time they need insights from the data.
Once the data ingestion is set up from the relevant data sources affecting quality from the shop floor, it must be given context for the platform to understand it. Using a simple drag-and-drop interface, users can tell LinePulse valuable information about where the data comes from and what it means. This step also only needs to be completed once. After it is done, LinePulse has all the necessary information to understand the relationships between different aspects of the data.
After this setup, LinePulse is ready for any manufacturing or quality engineer to run an automated root cause analysis at any time.
How to automate root cause analysis step-by-step in LinePulse
So, you have LinePulse set up and configured. Here’s how to automate root cause analysis in the platform.
1. Configure your target for the automated root cause analysis investigation
A unit has failed an end-of-line test. You discover this, and open up LinePulse right away to run a root cause investigation through the platform.
After navigating to the “Root Cause Analysis” tab and selecting “Create New”, you are shown a list of machine signals from your line, grouped by station. This is where you choose the failure or outcome you want to analyze, and the affected stations.
In this example, we’ve selected “NvH Pass/Fail”, which, as it sounds, contains the binary “Pass or “Fail” data that flags when a unit fails this particular Noise/Vibration/Heat test. If your data offers more information, such as “Fail high side” and “Fail low side”, this allows you to investigate failures with more precision.
The failure you investigate does not have to be a categorical one. You can also investigate a continuous or measurement signal. LinePulse allows you to select a range of values that you determine as a “Pass” or “Fail”.
2. Categorize your target for analysis
You are next prompted to categorize your “target” – the target being the failure or outcome you are investigating. You can easily drag and drop the values into their respective boxes. This instructs LinePulse to investigate only the values you define as “Target Failure Values”.
“Target Pass Values” are values that represent the ideal outcome — such as a passed test — in this example. If there are values or outcomes that are unassigned, they will be ignored by the analysis.
3. Review the features and refine if necessary
Next, you have the option to refine your query by including or removing any signals from the analysis. By default, all upstream signals are included.
You may want to use this step if there are any operations or signals that you are certain are unrelated to the failure to make the results more focused.
4. Apply filters to define the scope of your root cause analysis
In the last step, you define the scope of the automated root cause analysis investigation. You can determine the range of the query in two ways:
- A Time-based query limits the investigation to a certain number of records (cycles) until a specific time
- A part-based query limits the investigation to a range between two specified serial numbers
In addition, there are some optional customizations you can include:
- Specify which model number(s) you want to investigate
- Exclude any individual serial numbers
- Filter the results based on predefined part attributes, such as color
For this example, we’ve chosen to query 30,000 records (cycles) up until April 135th at 5:35pm.
5. Name and run your automated root cause analysis
Add a name to this query so that you can refer back to it later from the main list. You can add any additional context necessary in the “notes” section. This can help you refer back to it. You may run multiple queries on the same failure, experimenting with different settings to refine your results.
One you hit “run analysis”, the selected training data set is fed into LinePules’ auto re-training framework where the model is automatically trained. Once the model has been trained, the report is generated and auto-populated to LinePulse.
Depending on the size of the data set, and current server demands, RCA results are typically returned in 7-12 minutes. Just enough time for you to re-fill your coffee or respond to an email.
6. View the automated root cause analysis results
After a few minutes, your analysis results will be available from the main Root Cause Analysis screen. Select the most recent query in the list and you will be directed to the results screen.
On the left hand side, there is a list of the signals which have been found to be correlated to the failure based. These are listed in descending order of likelihood to have contributed to the target failure.
When you select one of these signals, a histogram on the right hand side of the screen charts the probability of that signal being the true cause in relation to the failure. You can scroll down to review the parameters you set for this analysis during the setup.
Applying automated root cause analysis on the shop floor
The results from the root cause analysis module are designed to provide quality and manufacturing teams with a preliminary list of signals with which to begin their investigation. Using this module can be an iterative process. If the results fail to identify the true root cause, a new query can be built using different time frames, serial numbers, or excluding certain signals or stations in order to provide more targeted results.
Automated root cause analysis for process change
In addition to finding the root cause of a problem, the root cause analysis module in LinePulse can be used to understand and improve processes that are still functioning within specification limits.
Any signal or test will naturally have values that may be within specification limits, but fall either to the high or low end. These outliers may not indicate a defect, but they are clues that some parts of the process are changing.
Here is an example of data from a leak test, which is an in-process verification station. Note the circled areas where there are spikes in the data. To ensure a stable and efficient process, the circled areas could be investigated to determine what upstream processes are impacting these results.
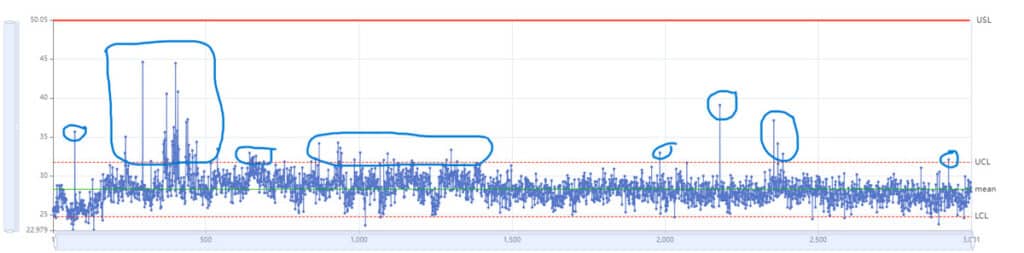
Using the root cause analysis module in LinePulse, you can target only the signal values that are on the high side, and learn more about the relationships between what is happening at previous operations to cause these high results. The parts are still “good” according to the specifications, but something along the way has changed that is causing these parts to leak more than the others.
Do I have enough data to automate root cause analysis?
The more granular the data you have, the more insightful results LinePulse can show you when you use it to automate root cause analysis. We wrote a brief primer on data here. The best way you can find out if you are collecting enough data already is to speak to a member of the Acerta team. You can ask these questions and more when you book a demo here.
Share on social: