


Articles
Machine learning and AI definitions for manufacturing
May 27, 2022
Introduction
This article explains key concepts related to artificial intelligence (AI) and machine learning (ML) in manufacturing. It covers definitions and applications of AI, generative AI, machine learning, deep learning, and various learning models, all focused on improving efficiency, quality, and decision-making in manufacturing processes.

Artificial intelligence
Artificial intelligence (AI) refers to computer systems that can perform tasks typically associated with human thinking, such as learning from experience, recognizing patterns, and making decisions. Rather than following strict, pre-programmed instructions, AI-enabled systems adapt their behavior based on new information and continually improve over time.
In the manufacturing industry, AI can be applied to enhance product design, optimize production schedules, or detect defects on the factory floor. By analyzing vast amounts of data—from sensors on equipment to historical supply chain records—AI helps manufacturers identify trends, predict future outcomes, and make more efficient use of resources.
Generative AI
Generative AI in manufacturing is an approach that uses advanced computer models to create or suggest new designs, processes, or solutions based on patterns it has learned. Unlike traditional machine learning tools—which excel at analyzing numbers, detecting trends, and making precise forecasts—generative AI is particularly good at producing new ideas. For example, it can automatically design complex parts, discover efficient production methods, or propose innovative product concepts.
However, when it comes to providing detailed insights drawn directly from large sets of numerical data—such as predicting exact production costs or pinpointing minor process inefficiencies—generative AI may not be as strong as more specialized machine learning algorithms that focus on patterns in big data. As a result, many manufacturers use a combination of generative AI (for creative, design-oriented tasks) and traditional machine learning (for data-driven, analytical tasks) to achieve the best outcomes.
Machine learning
Machine learning is a subset of artificial intelligence that relies on algorithms or statistical models to recognize patterns and make decisions, often from large volumes of numerical data—all without needing explicit, step-by-step instructions from a human programmer. In manufacturing, this can mean quickly spotting defects or predicting equipment failures by analyzing sensor data, production metrics, or quality reports.
Unlike generative AI, which specializes in creating new designs or ideas, machine learning is particularly strong at uncovering and interpreting existing data patterns—making it a go-to solution for quality control, predictive maintenance, and process optimization.
Deep learning
Deep learning is a specialized approach to machine learning that uses artificial neural networks—inspired by the way human brains process information—to recognize patterns and make predictions. These networks are built from layers of interconnected “nodes,” with hidden layers in the middle that allow the system to learn increasingly complex features of the data. Because of these deep, multilayered structures, deep learning algorithms excel at tasks like analyzing images, detecting defects, or predicting outcomes in highly variable environments.
Within manufacturing, deep learning can automate quality control by quickly identifying subtle product flaws, optimize supply chains by recognizing patterns in large datasets, and support predictive maintenance by spotting issues before they lead to equipment failures. While deep learning is one of the most popular AI techniques today, it’s not the only solution. The right AI approach depends on the specific challenge a manufacturer faces, as well as the quality and quantity of data available.
Regression Model
A regression model is a type of statistical and machine learning method that predicts a continuous numerical value—such as costs, quantities, or measurements—based on one or more input variables. By examining how these inputs relate to observed outcomes, the model can forecast new results for future or unseen data.
In manufacturing, this capability is especially useful for planning and optimization tasks. For example, a regression model might help predict future product demand, estimate equipment maintenance costs, or determine the necessary amounts of raw materials. By learning the relationships between input factors and a specific numeric outcome, regression models help manufacturers make more informed decisions, reduce waste, and improve overall efficiency.
Labeled and unlabeled data
If you want to use machine learning to improve operations, you’re going to need data. In good news, most manufacturers are already collecting and storing a lot of data. In addition to outputs from testing and production, you might also have environmental data, maintenance records, shift schedules, and many other data sources. Each point in your datasets can be thought of as an individual unit described by features.
Think of a spreadsheet. Your data points are like rows and your features are like columns. For example, if you’re looking at the data from an NVH (noise, vibration, and harshness) testing station, those features include frequency and amplitude. When it comes to machine learning, the particular features of a dataset are less important than whether the data is labeled or unlabeled.
- Unlabeled data lacks tags or explanations for what it is. Think of a series of results from an end-of-line test without any indication as to which units passed or failed.
- Labeled data is augmented with a tag or classification, such as pass or fail, which provides additional information.
You can apply machine learning to both labeled and unlabeled data but your approach will differ depending on the type of data you’re dealing with.
Supervised, unsupervised, and semi-supervised learning
The terms supervised learning and unsupervised learning are often used when we talk about machine learning. These learning styles describe different algorithms we can use to solve machine learning problems. The style that you use depends on the data you have and the problem you’re trying to solve. There’s also semi-supervised learning. Here are a few points about each of them.
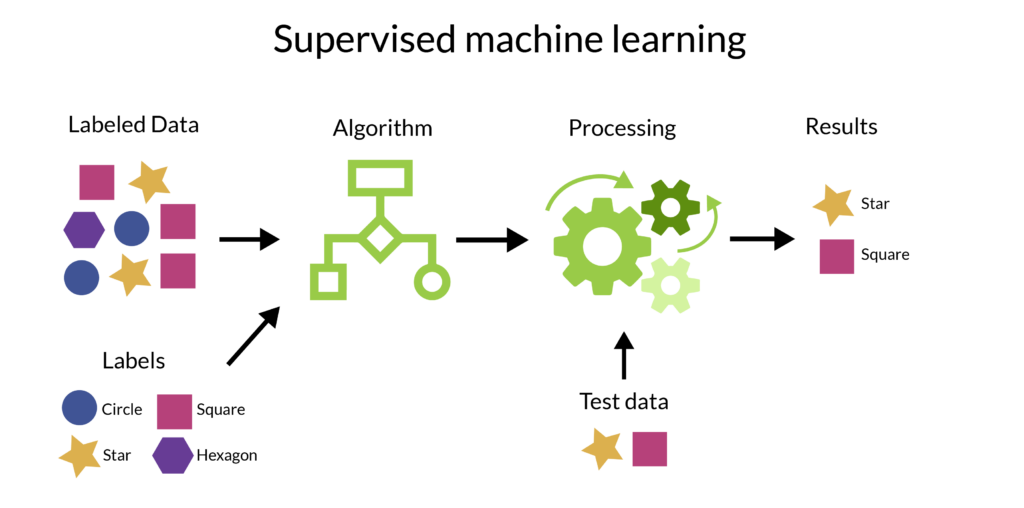
Supervised learning
The learning approach for labeled data is called supervised learning. It involves presenting a machine learning model with training data and a desired output. For example, you can apply supervised learning to a set of historical testing data, with units labeled as passing or failing, to predict whether units will pass or fail in the future.
Let’s say you want your model to distinguish between defective and non-defective transmissions. By showing the model some historical data, you can teach it what a defective transmission looks like so it can recognize when a new unit is defective. Labels tell the model what counts as defective and non-defective so it can classify new transmissions into one of those two categories. This is an example of a classification problem, where the solutions are qualitative. You can also use supervised learning for regression problems that have numerical solutions, like predicting frequencies for NVH testing.
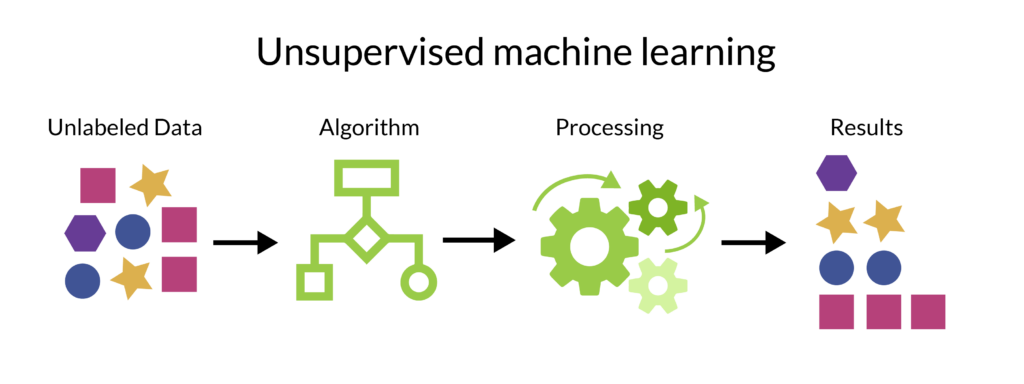
Unsupervised learning
The approach for dealing with unlabeled data is called unsupervised learning. It involves grouping units together with certain probability densities based on the similarity of their features. You can use unsupervised learning to identify anomalies in production data that result from subtle changes that conventional quality processes may miss, such as tool wear.
Unsupervised models are able to group data points and features without being told what to look for. Although there’s no specific target to predict, the model can map the underlying structure of a dataset. It cannot tell you which units passed or failed at an end-of-line test but it can group those units according to their similarities and separate them by their differences.
Semi-supervised learning
In semi-supervised learning, only one feature is labeled. For example, if you only label engine misfires but no other failure modes, you would only be able to train the model on engines that misfire and classify engines as either misfiring or not.